Summary: use the setProfilingLevel() API on your SNPEBuilder object and snpe-diagview on the output logs to view them in a human-readable format
Problem
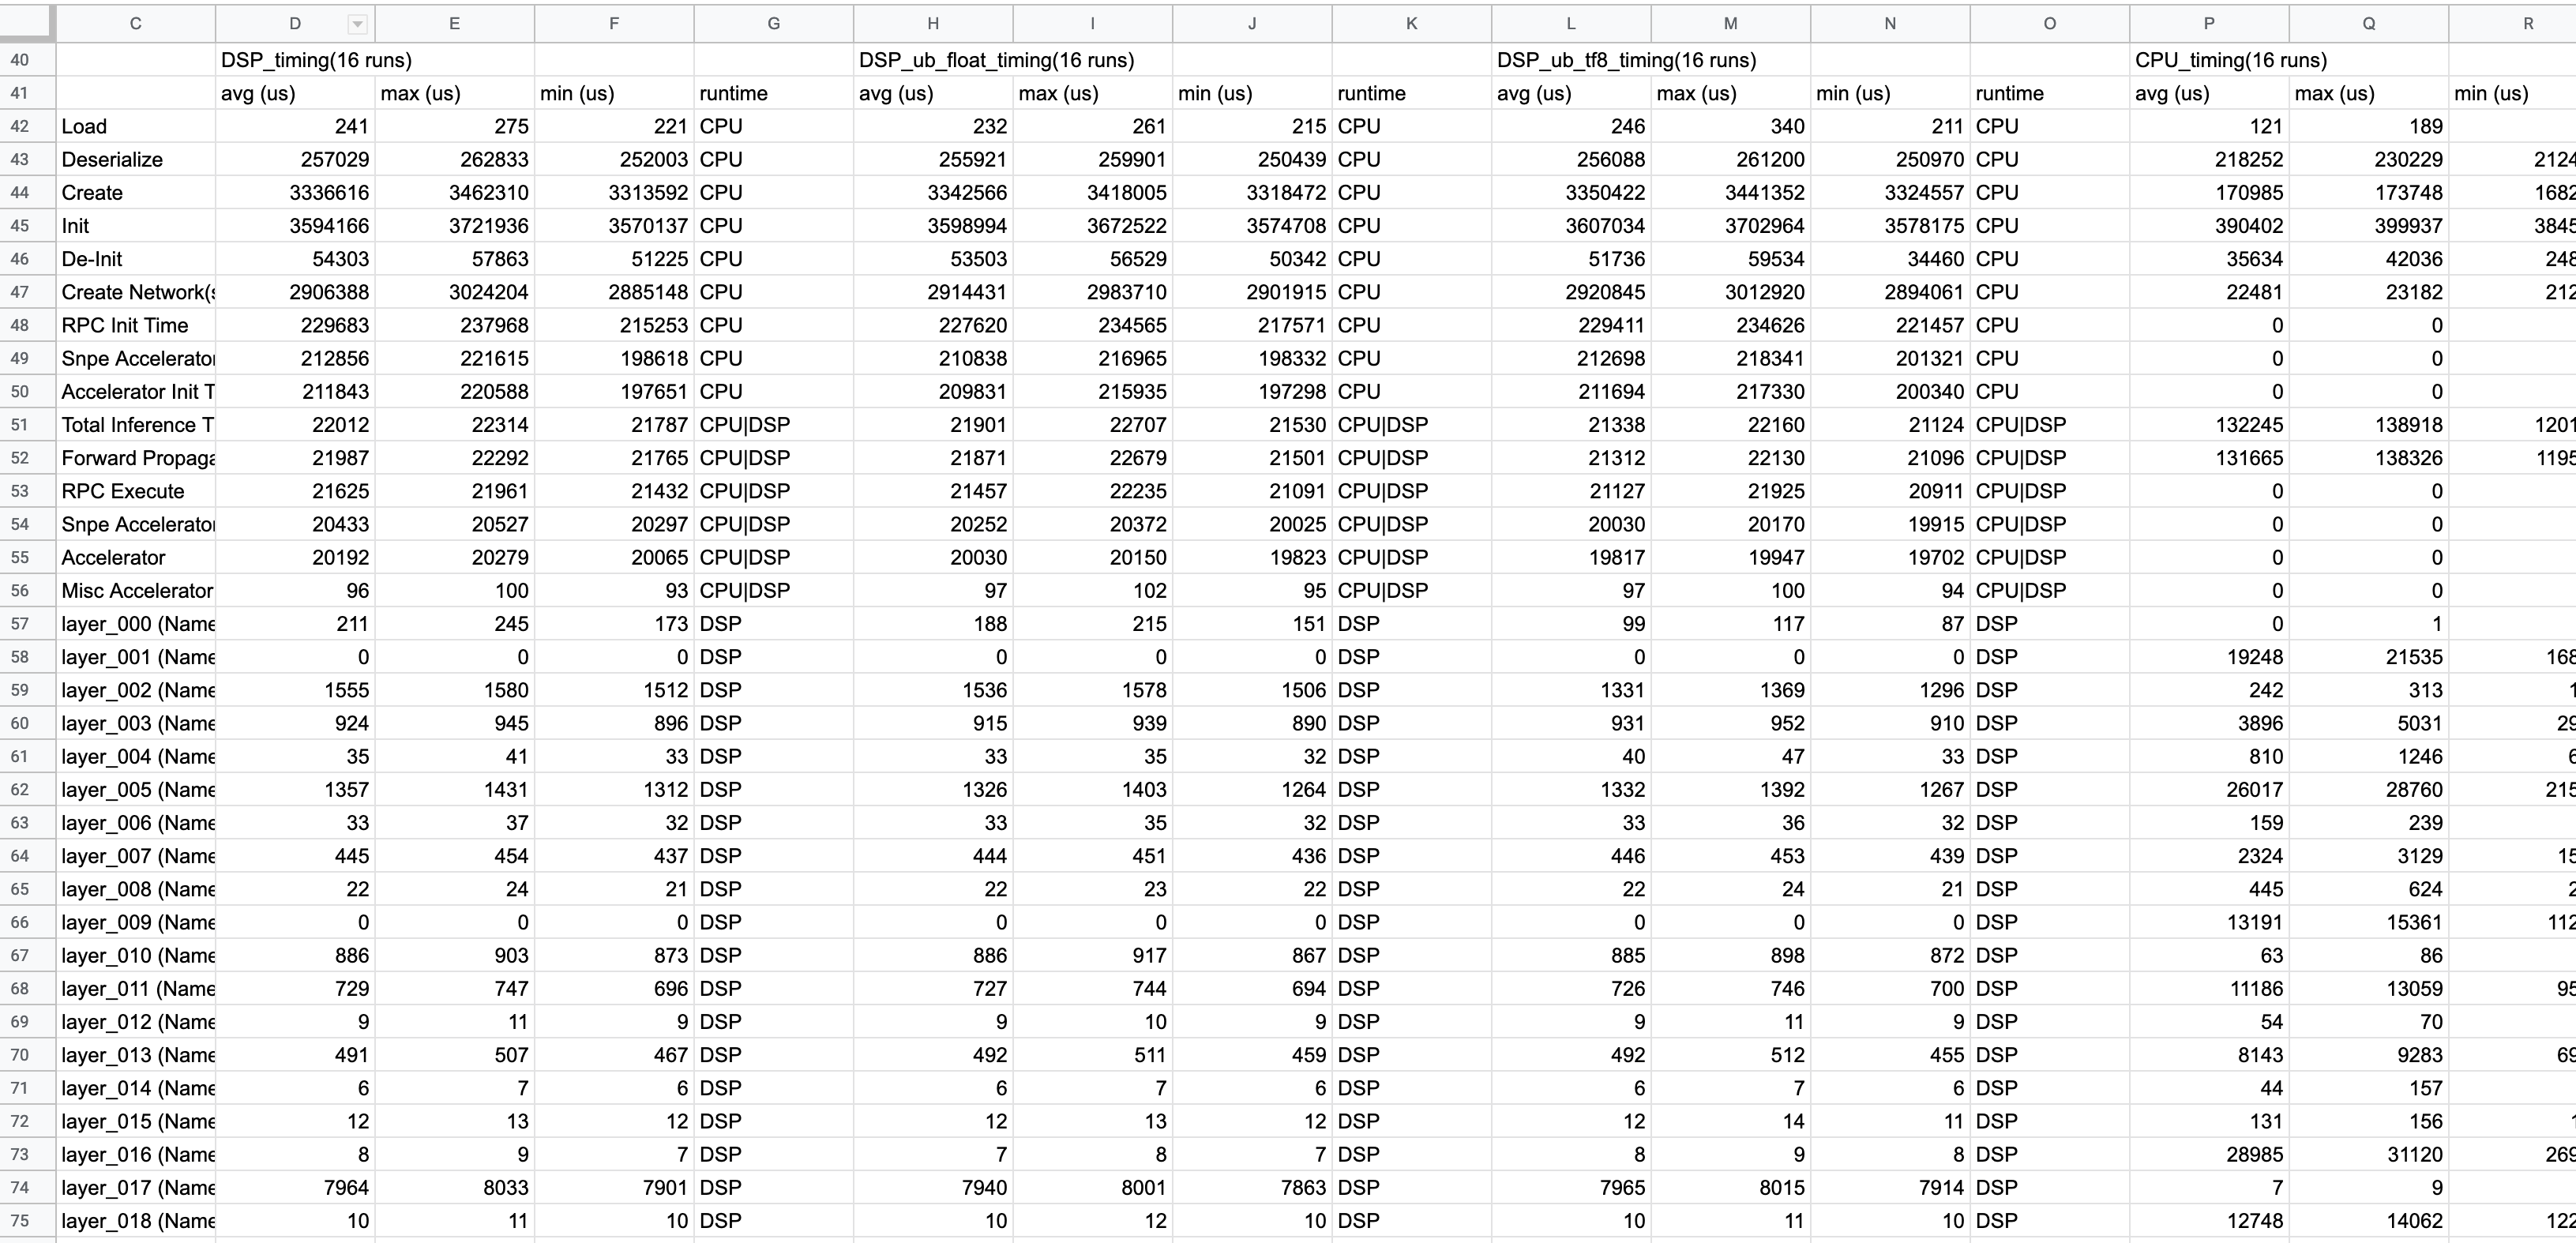
Qualcomm equipped their Snapdragon Neural Processing Engine SDK (SNPE) with a handy benchmarking utility called snpe_bench.py; the input a neural network model in Qualcomm’s Deep Learning Container (DLC) file format together with some data. Below are the results when setting the “ProfilingLevel” parameter in the benchmark JSON description to “detailed”.
These results are incredibly useful. However, a user does not always have the freedom to pass his model execution through the snpe_bench.py script, especially if the model is embedded in an application. In the rest of this writeup I show how to get the same fine-grained profiling information in your own application.
Solution
The snpe_bench.py script does nothing more then:
- Parse your JSON benchmark configuration
- Copies the necessary files to run your model to a device
- Creates a shell script that, on a device, (i) sets up the necessary LD_LIBRARY_PATH on a target device (ii) passes the DLC model and data to the snpe-net-run command
The snpe-net-run is less magical than it might at first seem. It is essentially just an extension of the example C++ application from the SNPE SDK. It loads and executes a model on the device using SNPE’s C++ API. To enable the profiling that snpe_bench.py outputs simply add a call to setProfilingLevel() when creating the “SNPEBuilder” object in your application.
Example (shortened outtake from the NativeCpp example in the SNPE SDK):
...
std::unique_ptr<zdl::SNPE::SNPE> snpe;
zdl::SNPE::SNPEBuilder snpeBuilder(container.get());


auto prof_level = zdl::DlSystem::ProfilingLevel_t(DETAILED);
snpe = snpeBuilder.setProfilingLevel(prof_level).build();
return snpe;
The application will then generate a “SNPEDiag.log” file (or similar) in the output directory. This log file can be viewed/converted to CSV using the snpe-diagview utility.